Toggle navigation
Accueil
Nos agences
Louer ou acheter son bien : les meilleurs investissements
Dernières annonces immobilières mise en ligne
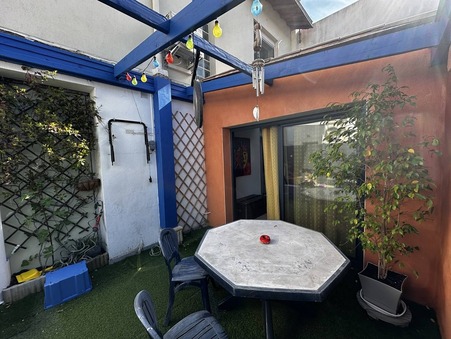
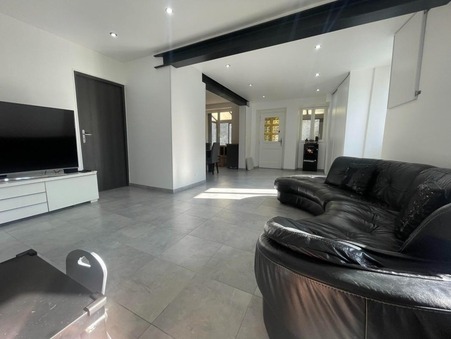
Location
Maison 5 pièces
Palavas les flots
897€
En savoir plus
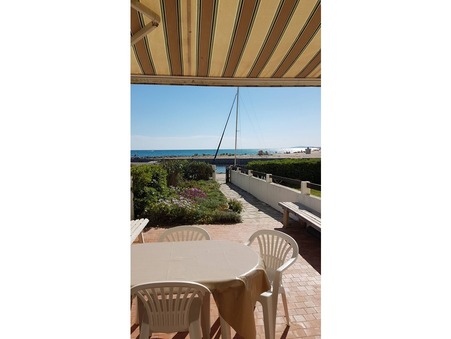
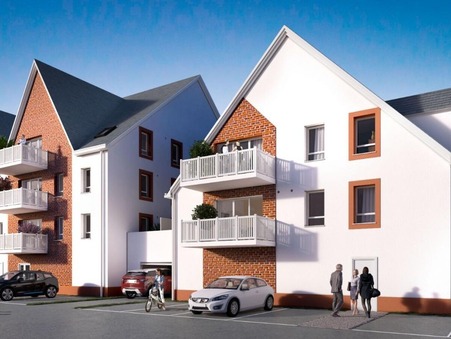
Location
Appartement 2 pièces
Palavas les flots
940€
En savoir plus
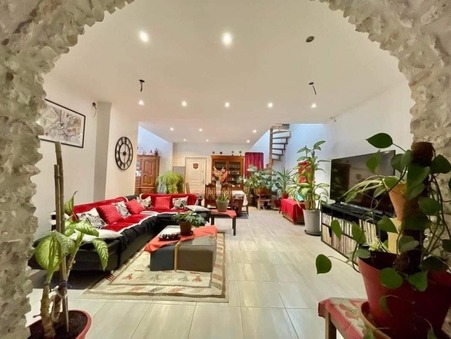
Vente
Appartement 2 pièces
Deauville
220 297€
En savoir plus
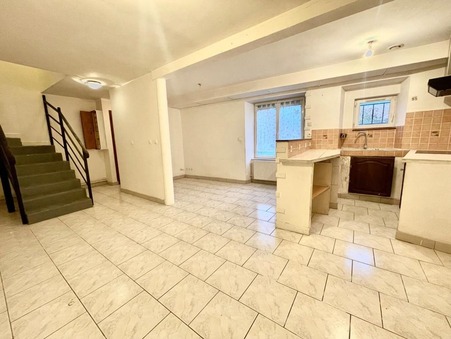
Vente
Maison 5 pièces
Toury
203 500€
En savoir plus
Vente
Maison 3 pièces
Gommerville
108 000€
En savoir plus
Vente
Maison 4 pièces
Fresnay-l'évêque
209 990€
En savoir plus
Vente
Maison 4 pièces
Courseulles-sur-mer
331 000€
En savoir plus
Vente
Maison 4 pièces
Courseulles-sur-mer
320 000€
En savoir plus
Vente
Maison 4 pièces
Courseulles-sur-mer
324 000€
En savoir plus
Vente
Appartement 4 pièces
Ouistreham
415 000€
En savoir plus
Vente
Appartement 2 pièces
Ouistreham
263 000€
En savoir plus
Vente
Appartement 2 pièces
Ouistreham
213 000€
En savoir plus