Toggle navigation
Accueil
Nos agences
Louer ou acheter son bien : les meilleurs investissements
Dernières annonces immobilières mise en ligne
Vente
Maison 10 pièces
Grans
1 500 000€
En savoir plus
Vente
Maison 6 pièces
Grans
695 000€
En savoir plus
Vente
Maison 4 pièces
Lamanon
477 250€
En savoir plus
Vente
Maison 4 pièces
Mouriès
630 000€
En savoir plus
Vente
Maison 6 pièces
Salon de provence
525 000€
En savoir plus
Vente
Maison 4 pièces
Eyguières
350 000€
En savoir plus
Vente
Maison 6 pièces
Eygalières
998 000€
En savoir plus
Vente
Maison 5 pièces
Eyguières
570 000€
En savoir plus
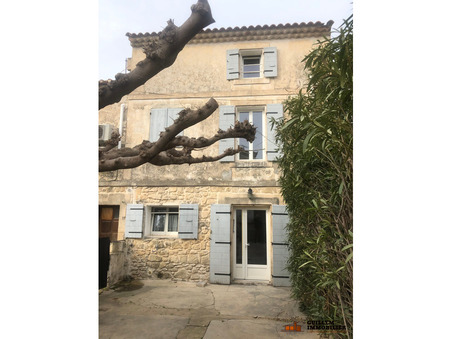
Vente
Maison 3 pièces
Fontvieille
275 000€
En savoir plus
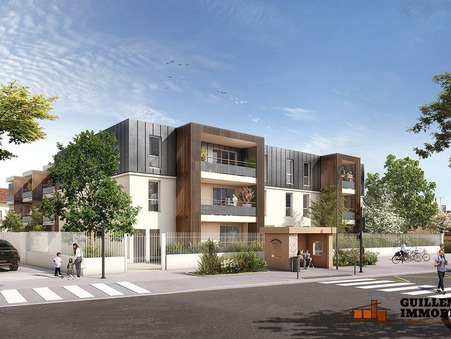
Vente
Appartement 2 pièces
Vitrolles
228 500€
En savoir plus
Vente
Appartement 3 pièces
Vitrolles
299 500€
En savoir plus
Vente
Appartement 2 pièces
Vitrolles
237 500€
En savoir plus