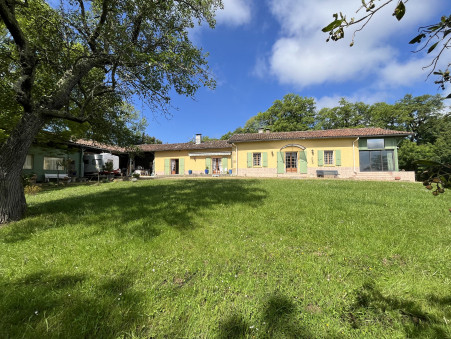
Simorre
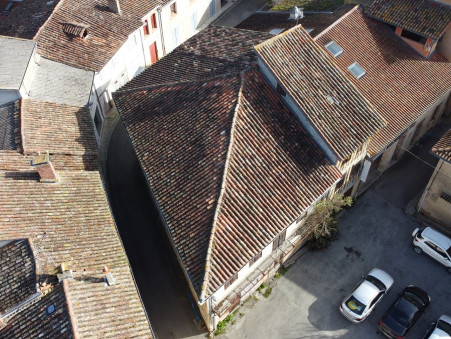
L'isle en dodon
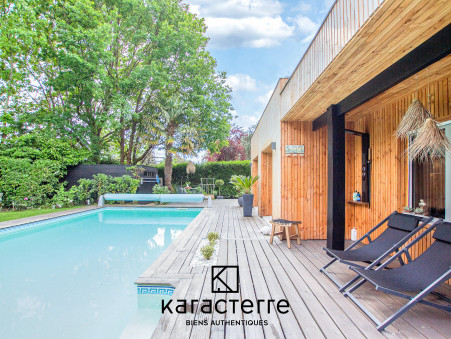
Lege cap ferret
Bordeaux
Aix-en-provence
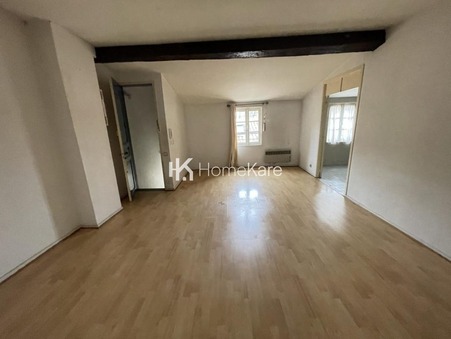
Tournefeuille
Marseille 8e arrondissement
Vieille-toulouse
Saint-orens-de-gameville
Escalquens
Quint-fonsegrives