Toggle navigation
Accueil
Nos agences
Louer ou acheter son bien : les meilleurs investissements
Dernières annonces immobilières mise en ligne
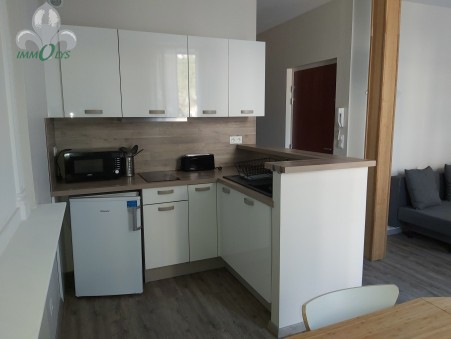
Location
Appartement 2 pièces
Beaune
630€
En savoir plus
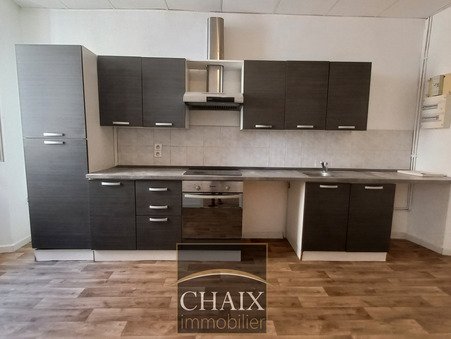
Location
Appartement 2 pièces
Aubagne
701€
En savoir plus
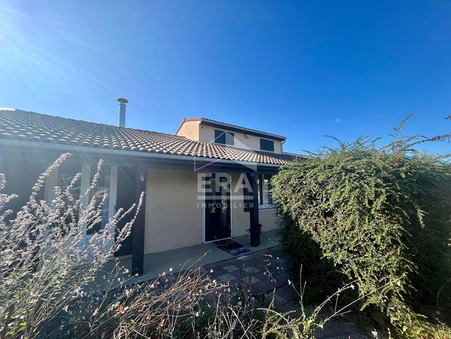
Vente
Maison 6 pièces
Labarthe sur leze
345 000€
En savoir plus
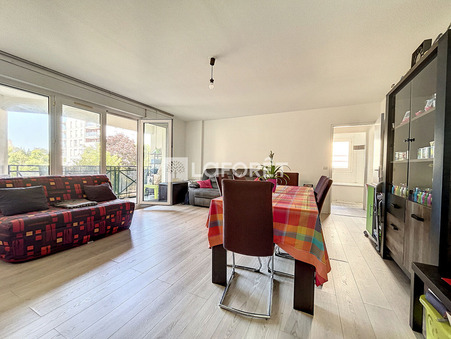
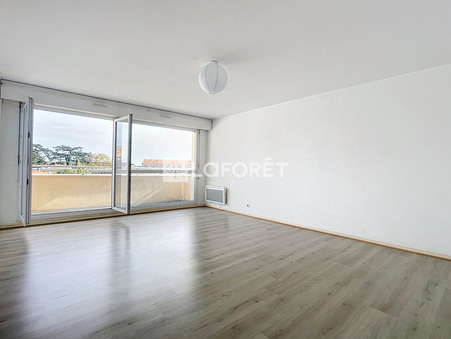
Vente
Appartement 2 pièces
Bordeaux
209 000€
En savoir plus
Vente
Appartement 2 pièces
Bordeaux
232 000€
En savoir plus
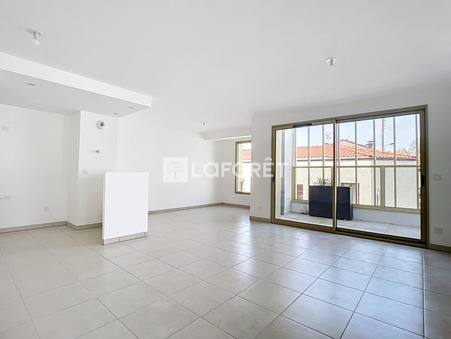
Vente
Appartement 3 pièces
Bordeaux
415 000€
En savoir plus
Vente
Appartement 1 pièce
Toulouse
165 870€
En savoir plus
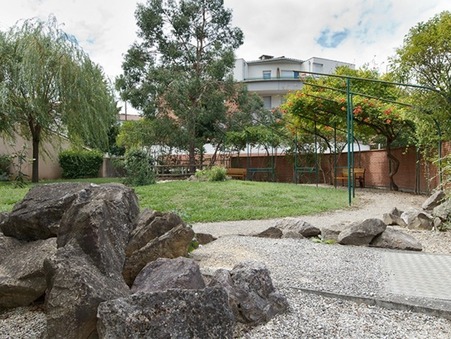
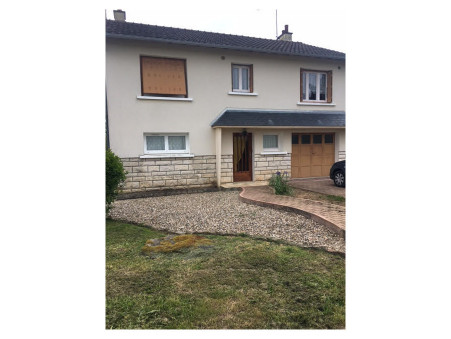
Vente
Maison 6 pièces
Saint-désir
318 000€
En savoir plus
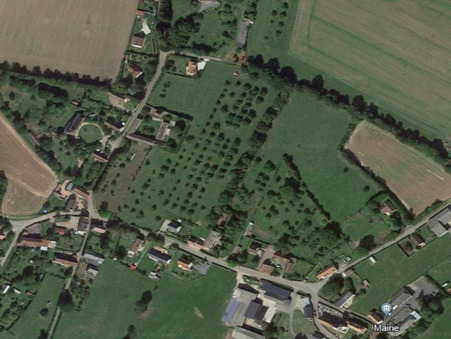
Vente
Terrain
Falaise
44 000€
En savoir plus
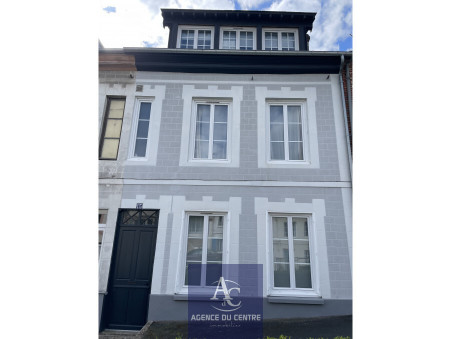
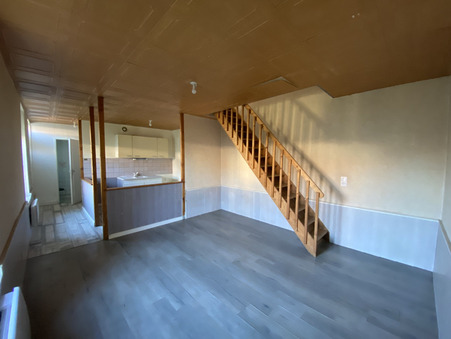
Vente
Maison 4 pièces
Massay
111 000€
En savoir plus
Location
Maison 3 pièces
Vierzon
400€
En savoir plus
Vente
Maison 4 pièces
Vierzon
88 000€
En savoir plus